The Mathematics and Probability Models Behind Roulette Wheel Bias Analysis
Let’s be honest—most people see a roulette wheel as the perfect symbol of pure, unadulterated chance. The ball dances, the wheel spins, and fate decides. But what if the wheel itself had a memory? A slight, physical imperfection that could, in theory, be mapped and predicted? That’s the tantalizing premise behind roulette wheel bias analysis. And it’s not magic; it’s cold, hard math.
Here’s the deal: we’re diving into the probability models and statistical frameworks that turn a casino game into a data science project. It’s a world where physics meets statistics, and where the dream of beating the house relies on one simple idea—nothing in the real world is perfectly random.
The Foundation: What Is a Biased Wheel, Really?
Imagine a brand-new vinyl record with a tiny warp. The needle hits that spot and, well, skips. A roulette wheel can develop similar “warps” over time—a slight dip in a pocket, a worn-down fret, a tilt on the axle, even a buildup of dust. These tiny defects can make certain numbers or sections “hit” more often than pure probability says they should.
That’s the bias. It doesn’t mean number 17 will win every time. It means that over thousands of spins, the distribution of results will stray from the expected probability model for a fair roulette wheel. Finding that stray signal in a mountain of random noise is the whole game.
The Starting Point: Expected Probability in a Perfect World
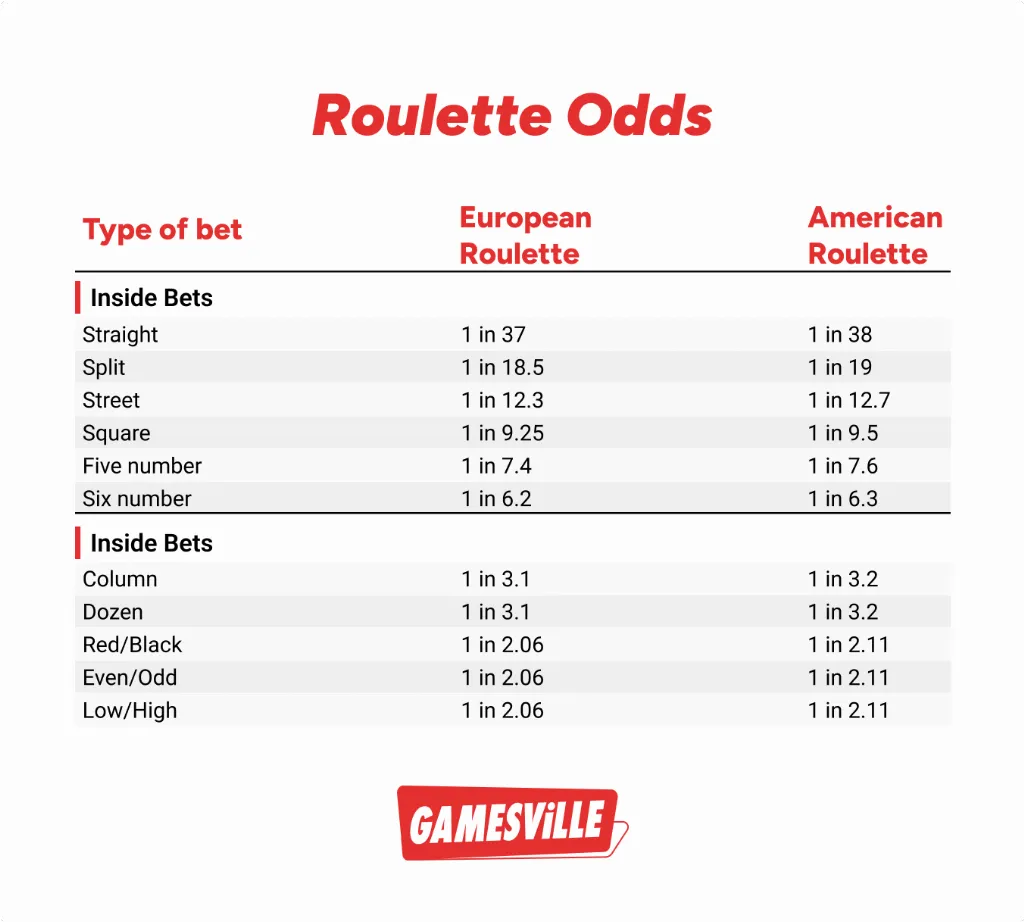
Before you can spot the abnormal, you gotta know what normal looks like. In European roulette (with a single zero), the math is straightforward:
- Probability of any single number: 1/37, or about 2.7%.
- Probability of an even-money bet (like Red): 18/37, or about 48.65%.
This creates a beautiful, flat statistical distribution. Each number is an island, equally likely. The law of large numbers tells us that as spins approach infinity, the observed frequency of each number will converge on that 2.7%. A biased wheel disrupts this convergence. Some numbers start to, you know, stick out.
The Chi-Squared Test: The Bias Detective’s First Tool
So you’ve been recording spins (a lot of them—we’re talking thousands). You see number 26 has come up 50 times in 1500 spins. Is that luck, or is it a pattern? Enter the Chi-Squared Goodness-of-Fit test.
This test is basically a reality check. It compares your observed results (what actually happened) with the expected results (what should happen on a perfect wheel). It spits out a p-value. A very low p-value (typically below 0.05) is a red flag—it suggests the difference between your data and a fair wheel is statistically significant. It whispers, “There might be a bias here.”
But—and this is a huge but—it’s only a starting gun. The Chi-Squared test can tell you if something is likely wrong, but not exactly what or where the bias is. It’s like hearing an odd noise in your car engine. You know there’s a problem, but you still need to pop the hood.
Going Deeper: Sector Analysis and Regression Models
If the Chi-Squared test raises an eyebrow, the real investigation begins. Analysts don’t just look at single numbers. They look for biased roulette sectors.
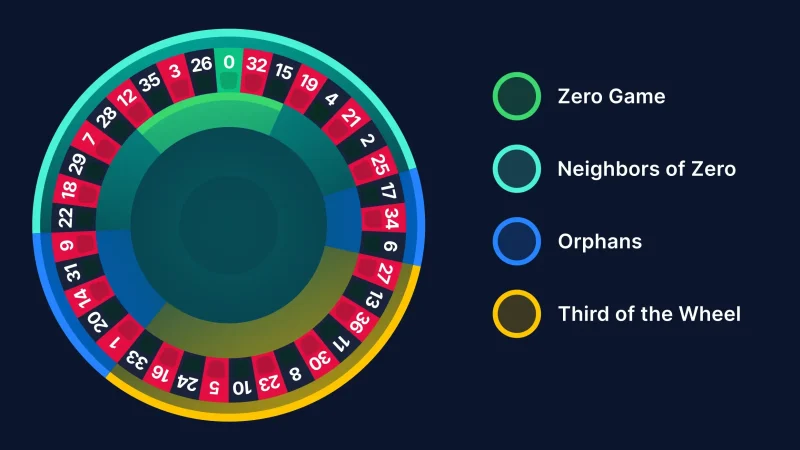
Think about it physically. A worn section of the wheel head might affect a whole neighborhood of pockets. A slight tilt might favor a whole hemisphere of the wheel. So analysts group numbers by physical location on the wheel (not the table layout, which is different!). They then run tests on these sectors.
| Analysis Type | What It Looks For | The Math Behind It |
| Single-Number Bias | One pocket hitting too often. | Binomial distribution, confidence intervals. |
| Sector Bias (e.g., 10-number arc) | A physical cluster of pockets outperforming. | Chi-Squared on grouped data, rolling averages. |
| Dynamic Bias (Deceleration) | Where the ball lands as wheel speed changes. | Time-series analysis, regression modeling. |
This is where regression models for wheel prediction can come into play. More advanced analysts might try to model the relationship between, say, the wheel’s deceleration rate and final ball resting position. It’s incredibly complex, blending physics with stats. Honestly, it’s where the line between analysis and prediction gets really blurry—and where casinos get very, very nervous.
The Mountain of Data: Why Sample Size Is Everything
Here’s the painful truth that crushes most would-be bias hunters. The sample size needed is enormous. We’re not talking about a lucky weekend.
- To reliably identify a single biased number, you might need 3,000+ spins just for a preliminary hint.
- For a confident, actionable bias? Some models suggest over 8,000 spins for a single wheel.
- And that’s assuming the bias remains stable. Casinos maintain wheels, which can erase your hard-found edge overnight.
The Modern Reality: Is This Even Possible Today?
In the golden age of mechanical wheels, bias analysis had its moment. Famous teams like the Eudaemons used early computers in the 1970s to find these imperfections. But today? Well, it’s a different ball game—literally.
Modern casinos use high-quality, regularly maintained and rotated wheels. They also employ sophisticated electronic monitoring to track outcomes themselves, looking for the same anomalies you are. The low-hanging fruit is long gone. The mathematics of roulette bias is now largely a theoretical or historical pursuit for most players… but that doesn’t make it less fascinating as a statistical exercise.
A Thought-Provoking Conclusion: The Illusion of Control
Studying roulette wheel bias analysis, in the end, is less about a get-rich-quick scheme and more about a profound lesson in probability. It showcases the relentless human desire to find order in chaos. We build perfect mathematical models for a perfect world, then use even more sophisticated math to measure how the real world—with its grime, wear, and imperfection—deviates from that ideal.
The math works. The probability models are sound. If a wheel is biased and you have enough data, you can, in theory, gain an edge. But the universe—and the casino industry—fights back with randomness, maintenance, and counter-measures. It becomes a metaphor, really. The house always has a statistical edge, but for a brief moment, with enough work and luck, a tiny crack in that foundation can be measured, quantified, and maybe, just maybe, exploited. That possibility, however slim, is what keeps the dream—and the mathematics—spinning.